I tracked Apple’s Top 200 Podcasts for two years. Here’s what I found.
In March 2017, I published the results of a year-long analysis of the Apple Podcasts US Top 200 charts. The goal was to better understand which categories are most represented in Apple’s charts, as a proxy for the American podcast zeitgeist.
I left my script running for another year, so now I have two full years of chart data to analyze. Let’s dig in.
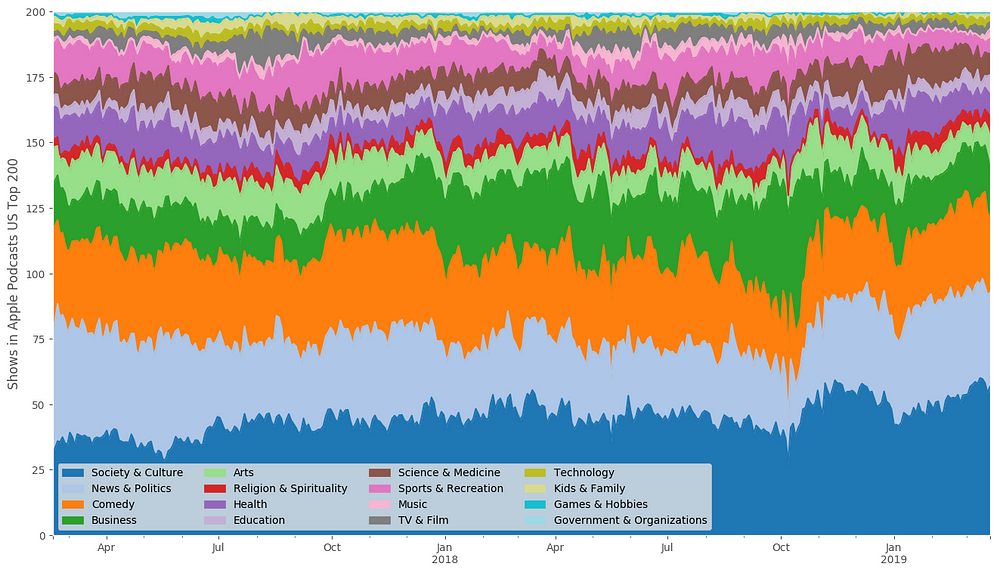
Some things have stayed the same since my original post. Society & Culture is still the most-represented top-level category on the Apple Charts. Once again, News & Politics, Comedy, and Business and also rank highly. In fact, for the past several months, the top 3 most-represented categories have made up more than half of the entire Top 200.
Of course, the Apple charts are a zero-sum game. For every show that enters the chart, another one gets knocked off. And for every category that grows in representation, another shrinks. That becomes apparent when we compare categories against each other:
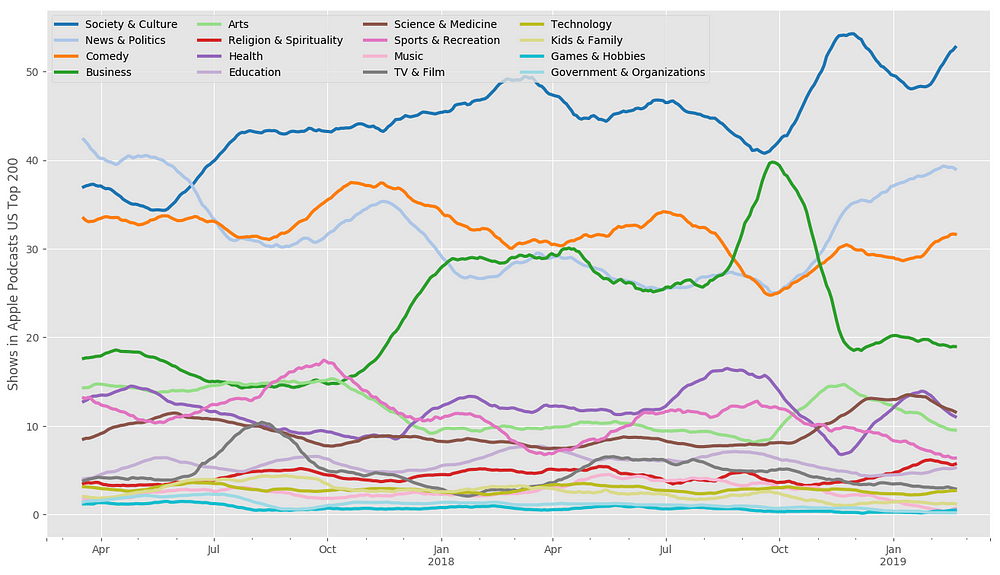
With two years’ worth of data to work with, we can now try to spot trends and seasonal patterns in the makeup of the Apple Podcasts Top 200.
Here are a few that stood out to me:
Society and Culture continues to grow
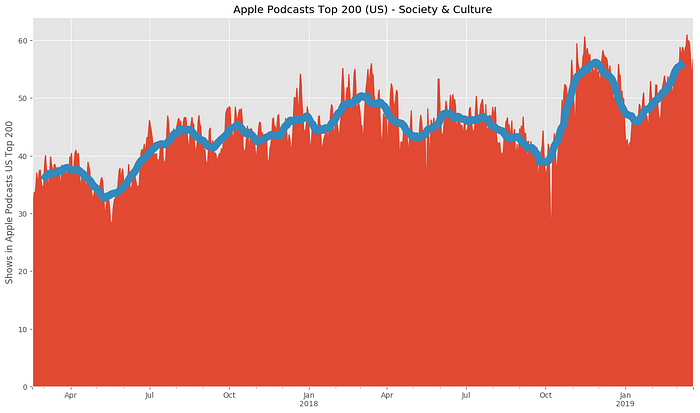
Society & Culture is a big, broad category. It includes true crime shows like Dirty John, music shows like DISGRACELAND, celebrity-hosted shows like Dr. Phil’s Phil in the Blanks, public radio veterans This American Life, and many more.
Consequently, Society & Culture is among the most crowded in Apple Podcasts. It also continues to be the most-represented category in the Top 200, accounting for more than 25%of the shows listed.
As podcasting reaches ever-larger, more mainstream audiences, the popularity of shows in such a big, broad category doesn’t come as a surprise.
Sports spikes (🏈?)
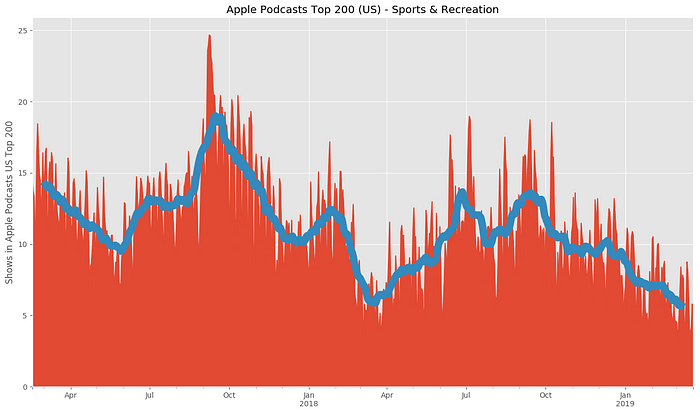
Last year, I hypothesized that a September spike for Sports & Recreation might be related to the beginning of the NFL season.
Overall, Sports & Recreation shows were less present on the Top 200 in 2018, but again, we saw a spike in September… right around the beginning of NFL football.
Something weird happened with Business podcasts

For a few weeks in September-October 2018, the number of Business podcasts in the US Top 200 shot up like a rocket, then quickly fell.
This timeline aligns with several reports about podcast chart manipulation, many of which cite Business shows as examples. Coincidence? I suspect not.
For reference, here are the shows that appeared on the Business charts in mid-October 2018, at the peak of that category’s representation on the US Top 200. And here are the shows that appears on the charts in mid-November 2018, once representation returned to previous levels.
I’ll let sharp-eyed chart-watchers draw their own conclusions by comparing the two charts side-by-side.
The New Year’s Health bump
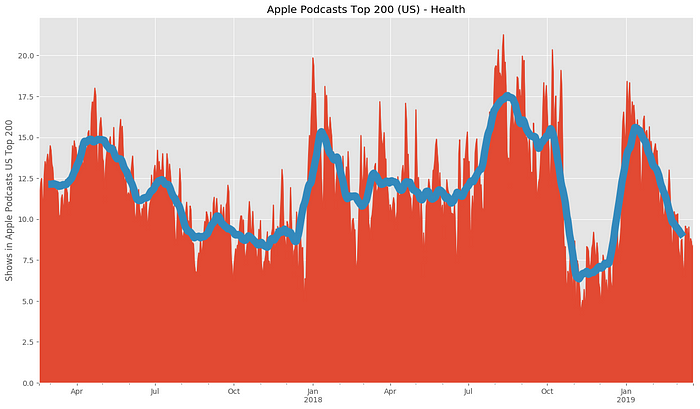
If you look closely at both January 2018 and January 2019, you’ll see a noticable bump in the number of Health shows on the US Top 200, which drops off in the following weeks.
It’s almost like you can see podcast listeners looking for audio content to help them stick to their health-related New Year’s goals. If I was making a Health podcast, I know which month I’d choose to launch.
As I wrote last year:
Timing matters. Podcasts are a medium that fits into people’s lives alongside their other habits and routines.
Whether you’re launching a new show or promoting an existing show, tap into the zeitgeist. Embrace seasonality. Think about what else is going on in the world, and what else is going on in your listeners’ lives.
Then add value.
Still true.
Sign up for the Pacific Content Newsletter: audio strategy, analysis, and insight in your inbox. Once a week.
